Height premiums remain invisible to most buyers. They see a price tag. They don't see the view. They don't understand the value gap between floor 5 and floor 25. This visibility gap kills conversion rates on mid and lower floors.
Real estate developers lose revenue on these units. Buyers discount them heavily. Sales teams repeat the same explanations across dozens of site visits. Marketing budgets stretch thin chasing clarity that never arrives.
The problem isn't the units. The problem is perception.
The Core Challenge: Buyers Can't Visualize Height Benefits
Lower floors underperform. They carry higher vacancy rates. Buyers negotiate aggressively. Developers discount to move inventory.
Why? Ground and lower-floor units suffer from real issues:
Reduced natural light penetrates deeper into buildings
Street noise disrupts daily living and sleep
Limited views restrict sightlines to the horizon
Longer elevator waits during peak hours frustrate residents
Less air circulation affects air quality and ventilation
Mid and upper floors deliver the opposite experience. Light floods through windows. Views extend across skylines. Quiet prevails. Air moves freely. Elevator access improves.
Yet buyers struggle to translate these benefits into price justification. Site visits create temporary impressions. Verbal explanations fade. Marketing materials show isolated units without context. Buyers walk away confused about what they're actually paying for.
Why Traditional Sales Methods Fall Short
Physical site visits consume time. Sales agents guide buyers up and down. Impressions shift with weather and time. A rainy afternoon on floor 8 looks nothing like a clear sunset from floor 28. Buyers leave without understanding the true experience.
Competitors show glossy renderings. Buyers compare flat images across projects. Apples-to-apples comparisons become impossible. Lead drop-off accelerates post-visit. Sales teams schedule repeat tours. Costs multiply. Conversions stall.
Developers need a tool that shows buyers what they're actually purchasing. Not tomorrow. Not after another site visit. Right now. During the sales conversation.
Floor Rise Visualization: Showing the Real Value
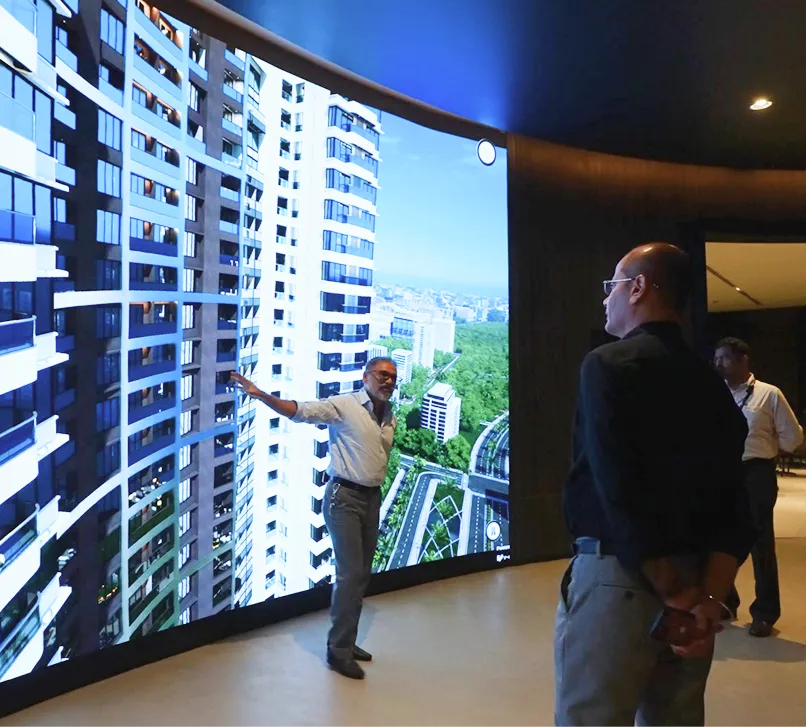
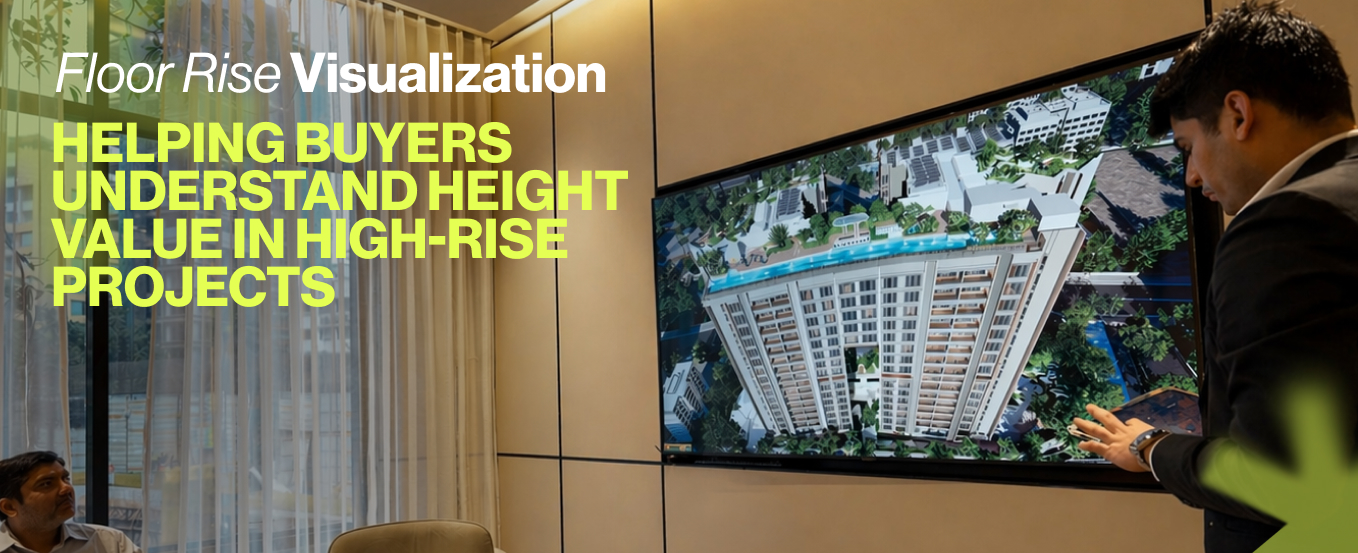
Floor rise visualization demonstrates height benefits in real-time. Buyers see exact views from floor 5, floor 15, floor 25. They witness how light changes. They understand why floor 20 costs 30% more than floor 8.
This isn't imagination. This is evidence.
Photorealistic 3D show flats render units to exact specifications. Buyers see actual furniture placement. They observe how morning light fills the bedroom on floor 12. They watch how evening sunlight angles into the living room on floor 22. Small details matter. Countertop finishes. Wall paint shades. Sofa positioning. These visual cues build confidence.
Window views shift floor by floor. Ground level shows rooftops and street activity. Mid-floors frame neighborhoods and nearby landmarks. Upper floors reveal distant horizons and skyline expanses. Buyers grasp immediately why elevation commands premiums.
Nearby amenities layer onto mapped views. Schools appear. Shopping centers highlight. Metro stations glow. Parks mark green spaces. Buyers plot their commute routes. They walk distances virtually. They understand accessibility from their actual floor. Connectivity becomes tangible, not theoretical.
Lighting controls matter. Buyers rotate through day-night cycles. Seasons shift shadows. Sunrise views from floor 18 look different from sunrise on floor 6. Sunset colors golden upper floors while lower units stay dim. Buyers experience these differences directly. Objections dissolve.
Customization tools empower buyers. Paint colors test against light. Furniture scales prove to rooms. Finishes display in context. Buyers capture their preferences. Sales teams document choices. Follow-up conversations become precise, not generic.
Real-World Results: Conversion Impact
A 40-floor Mumbai project faced stalled lower-floor sales. Buyers fixated on base prices. The visualization tool deployed across sales floors changed that dynamic.
Floor 10 displays revealed partial sea views. Floor 30 unveiled panoramic water-to-sky expanses. Sales teams handed tablets to buyers. Engagement doubled. Questions shifted from "Why is this expensive?" to "Which floor has the best view?"
Conversion rates climbed 25% on previously difficult floors. Buyers self-selected appropriate elevations. Serious prospects booked units faster. Inventory velocity increased.
Another Gurgaon high-rise sits near expressways. Ground floors faced heavy traffic glare and noise. The tool layered green belt visualizations across all floors. Upper floors framed hillside views. Buyers prioritized elevations naturally. Premium uptake jumped 35%.
Sales teams cut site visit frequency by 60%. Single tablet sessions covered all floors effectively. Agent time halved. Follow-ups used saved preference snapshots. Tour costs dropped significantly.
Operational Benefits Compound Over Time
Faster lead qualification happens automatically. Buyers self-select appropriate floors based on visual evidence. Serious prospects emerge. Pipeline quality improves.
Higher close rates follow naturally. Visual proof justifies premiums. Objections drop 50%. Negotiations center on legitimate preferences, not skepticism.
Cost reductions materialize immediately. Fewer physical mockups needed. Fewer repeat site visits required. Offline tools scale across multiple projects. Marketing budgets redirect to high-impact activities.
Data-driven pricing becomes possible. Track which floor views attract buyers. Monitor which amenity visualizations drive engagement. Adjust pricing strategies accordingly. Protect margins against discounts.
Sales teams gain confidence. Scripts shorten. Conversations deepen. Customer satisfaction builds because promises match reality. Post-sale experiences feel familiar because buyers saw everything beforehand. Retention rates improve. Referrals increase naturally.
Implementation Across Projects
Effective deployment follows structured steps:
Scan architectural blueprints. Build floor-by-floor 3D models. Accuracy reaches 99%.
Map site geography. Input amenities, road networks, horizon landmarks. GIS data adds depth and credibility.
Test on tablets. Ensure offline operation functions seamlessly. Battery life sustains full sales sessions without external power.
Train sales staff. Develop clear demonstration scripts. Effective floor walkthroughs complete in under 5 minutes.
Launch at pre-sales. Gather buyer feedback immediately. Refine visualizations quarterly based on real market response.
Track metrics. Monitor floor-wise sales velocity. Calculate ROI. Most projects see positive returns within 4-6 months.
The Competitive Edge in Dense Urban Markets
Mumbai, Delhi, Bangalore projects demand height-based differentiation. Land scarcity forces vertical density. Floor location defines value more than ever. Buyers increasingly demand proof before committing to premium prices.
Traditional marketing materials can't deliver that proof. Digital activations require internet connectivity that falters during crucial sales moments. Offline tools eliminate these barriers. Buyers get immediate, visual answers during the sales conversation.
Developers gain measurable edges. Marketing teams deliver quantifiable results. Sales professionals close faster. Customers feel informed and confident.
Start Visualizing Height Value Now
Floor rise visualization transforms high-rise sales from uncertain conversations into confident transactions. Buyers see what they're purchasing. Developers capture appropriate premiums. Sales teams convert faster.
Deploy this capability across your projects. Show buyers the actual view from their floor. Display real lighting conditions. Map their daily commute. Document their design preferences. Empower them to understand and embrace height value.
Start your visualization deployment this quarter. Let data drive your sales conversations. Watch conversion rates shift. Experience the operational efficiencies that follow.
Your buyers are ready to see what they're buying. Give them clarity. Watch your floor rise velocity follow.